
SafePASS
NEWS
SafePASS
NEWS
COMING SOON
COMING SOON
NEWS
WP6 RISK MODELLING TOOL – AN OVERVIEW OF THE NUMERICAL SIMULATION DATABASE
One of the biggest challenges in maritime safety is the integration of all the systems related to the evacuation and emergency response under one Decision Support tool that will broadly cover all the emergency cases and co-ordinate the evacuation process more efficiently. Besides, for a decision support tool to be useful we need to be able to calculate the Available time to Evacuate based on real-time data, such as the passenger distribution on board and of course based on the various sensor data that will monitor the damage and its propagation. For all the above, the risk modelling tool developed in SafePASS will be able to estimate the probable fatalities both in the design phase and in real-time, assessing the evacuation and abandonment risk dynamically, based on real-time data related to the passenger distribution, route, semantics, LSA availability, procedural changes, and damage case (fire or flooding) propagation.
To be more specific, the risk modelling tool is consisted of the following four components:
-
The Numerical simulation database
-
The Case-Based Reasoning Algorithm
-
The Dynamic Risk Analysis
-
The Risk modelling Tool dashboard
To begin with the numerical simulations database, a plethora of flooding, fire and evacuation simulations is conducted for critical scenarios. The database will be used for prognostic purposes, providing predictions on ship motions, blocked areas, evacuation and abandonment available time. Moving on to the Case-Based Reasoning Algorithm, this module is responsible for the selection of the most probable/matching scenario from the database, based on ‘live’ data received from the Core Engine. As far as the Dynamic Risk Analysis is concerned, it is responsible for calculating the Potential Loss of Life-based on the influence diagrams for each node of the event tree. The function determines, based on Module 1 (Numerical simulation database) and data from the Core Engine, the value of the top event of each influence diagram. In fact, we are transforming the unquantified influence diagrams into quantified Bayesian networks that determine the value of the event tree gates. These values will be updated within a time for loop based on the live information, on the influencing parameters of each node as well as data from the numerical simulations for the nodes that correspond to future time instances.

Finally, the Risk Modelling Tool Dashboard is responsible for the visualization of the results in order to support the crew officers and especially the Master of the vessel to take the appropriate actions accordingly.

Our efforts at this stage, are focused on performing the numerical simulations for fire, flooding and evacuation and developing the functions that would allow for the dynamic calculation of the top event on the various influence diagrams.
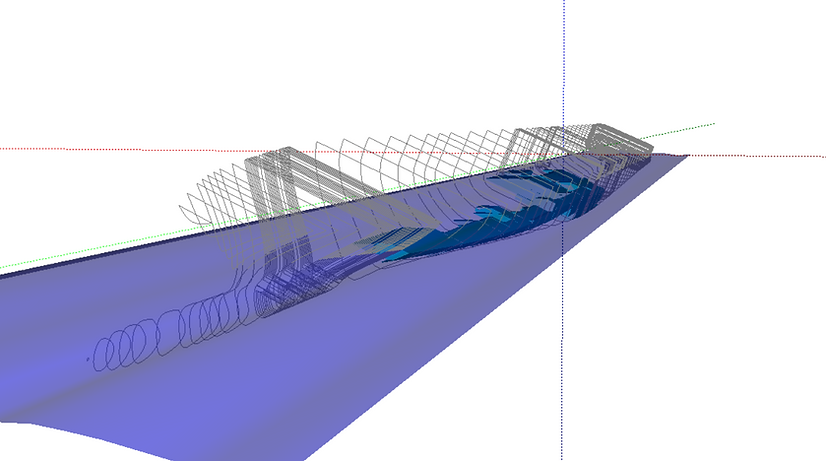
The flooding simulations are required to build the case base. The accuracy of those simulations is dictating the maximum possible accuracy of the prediction. The time-domain - state of the art, software PROTEUS is used to evaluate conditions across time. This method is much more accurate than static simulations in the presence of a seaway and transient phenomena. However, it is much more expensive computationally. The overall approach is to use static simulations to decide which cases require closer inspection with PROTEUS. The greater the size of the database the better the performance of the CBR methodology, but much more time will be needed to create and access the database. The output will be the expected time to capsize, or more specific information on when the vessel becomes unattainable. This is linked to the survivability of passengers and time available for effective evacuation but also to large roll angles which can severely slow or outright stop passengers and affect LSA deployment. Besides, the spaces untraversable due to flooding are also assessed. For instance, flooded corridors may slow down passengers or outright prohibit their use or watertight openings will probably be closed or unavailable.
To facilitate the fire risk aspect of the risk modelling tool, fire simulations are conducted using Pyrosim Software, a graphical user interface of the FDS software. More specifically, the results of such simulations will indicate which areas are blocked or impaired due to fire and smoke propagation or increased toxicity levels. In this way, the evacuation simulations will be also fully updated and ready to capture any given critical scenario.

Finally, evacuation simulations are crucial to calculate the evacuation time. For this reason, EVI is selected for its macroscopic and mesoscopic behaviour but also due to its high reputation to the maritime industry. Following, EVI has multiple uses in the SafePASS project. It is initially being used to benchmark specific scenarios. In the meantime, a series of accident flooding simulations are being examined, the outputs of which, in terms of ship motions and flooded areas will be fed into Evi with the purpose of assessing the available time to evacuate and calculating the number of potential fatalities. Besides, the fire data from Pyrosim are also imported in EVI.
Consequently, Evi is also playing a key role on the development of the dynamic risk model of the project which will serve as a real-time Decision Support System.

To sum up, as you may notice the numerical simulation database is vital to the creation of the Risk modelling tool. At this stage, the MSRC is close to the finalisation of this database and within the next few months, we will have the remaining three modules completed. In this way, SafePASS will provide to the decision-makers with a useful tool able to monitor and quantify risk in real-time and hence increase safety onboard Passenger vessels significantly.